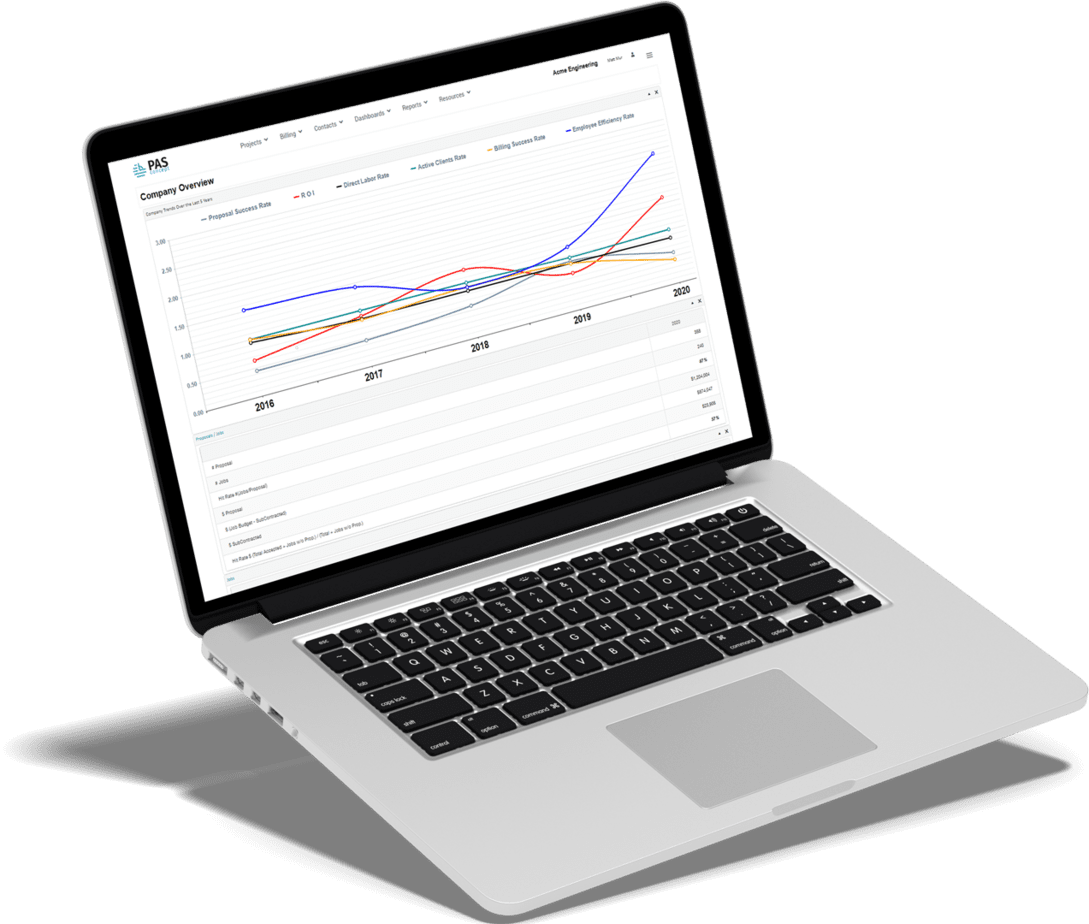


of your company
Graphics & Charts
See your data visualized in ways that help you gain additional perspective on your business.
Clients
View data that can help you maximize the value of your current clients and better position your company for future clients.
Project Maps
View your projects geographically. See the real-world impact your projects have in counties, cities, and neighborhoods.
Dashboard by Area
View dashboards related to every part of your company Invoicing, Jobs, Proposals, Employees and more.
Reports by Roles
Unlimited reports at your fingertips. View and explore dynamic reports specific to different roles and needs.

Better Data, Better Decisions
Minimize manual work by having real-time data at your finger tips
Benefit from PASconcpets library of pre-built reports, no more having to labor over excel spreadsheets
Access any report at any time without having to ask someone to generate it for you

